
To get a Supabase schema diagram you can keep, connect database design software to the project’s underlying Postgres database - session mode, port 5432 - and reverse engineer it. The Schema Visualizer inside Supabase Studio will not get you there: it is a viewer bolted onto the dashboard - the layout you make lives in one browser, and the most it can hand you is a flat image.
That distinction takes about a week of real use to feel. The visualizer demos beautifully - open the dashboard, click Database, click Schema Visualizer, and your tables appear with lines between them. Then you try to use it as documentation and the cracks show.
What the built-in Schema Visualizer actually gives you
The Schema Visualizer arrived in Supabase Studio 3.0 as an answer to one of the platform’s oldest feature requests, and it is genuinely useful for a first glance. But three limits surface quickly.
It shows one schema at a time. A Supabase project is never just public - there are auth, storage, and graphql_public at minimum, and the visualizer renders each in isolation. The picture of how your application tables relate to the platform’s is a picture nobody can draw in the dashboard. The gap is real enough that a community member built a separate tool to generate an ERD across all schemas - the “because Visualizer can’t” is in the project’s own tagline.
The layout lives in your browser, not in the project. Early versions opened vertically stretched and dropped your repositioning entirely; Supabase has since fixed the persistence half, so a dragged table now keeps its position across refreshes. But it keeps it in exactly one place: that browser’s localStorage, keyed to the project and schema. Nothing syncs to the project itself - a teammate opening the same visualizer gets the auto-layout, a new laptop starts from zero, clearing site data erases the arrangement, and the relationship lines cannot be reshaped at all. An arrangement only one browser can see is a preference, not documentation.
What leaves is a picture, not a document. The visualizer can download the current view as an SVG or PNG, and each table’s three-dot menu will copy that single table’s definition as SQL or Markdown - genuinely handy for a quick paste. What it cannot produce is a diagram document: a file another tool can reopen, a layout a teammate inherits, anything Git can diff in a pull request. Even the SVG is not what the extension promises - it is the dashboard’s HTML wrapped in a single foreignObject tag with the browser’s computed styles inlined on every element. Exporting the same database both ways: 6.4 MB from the visualizer, with no SVG text elements and blank output in vector editors, against 99 KB of true vector from Schemity. The export is a flat image of one schema, frozen at the moment you clicked.
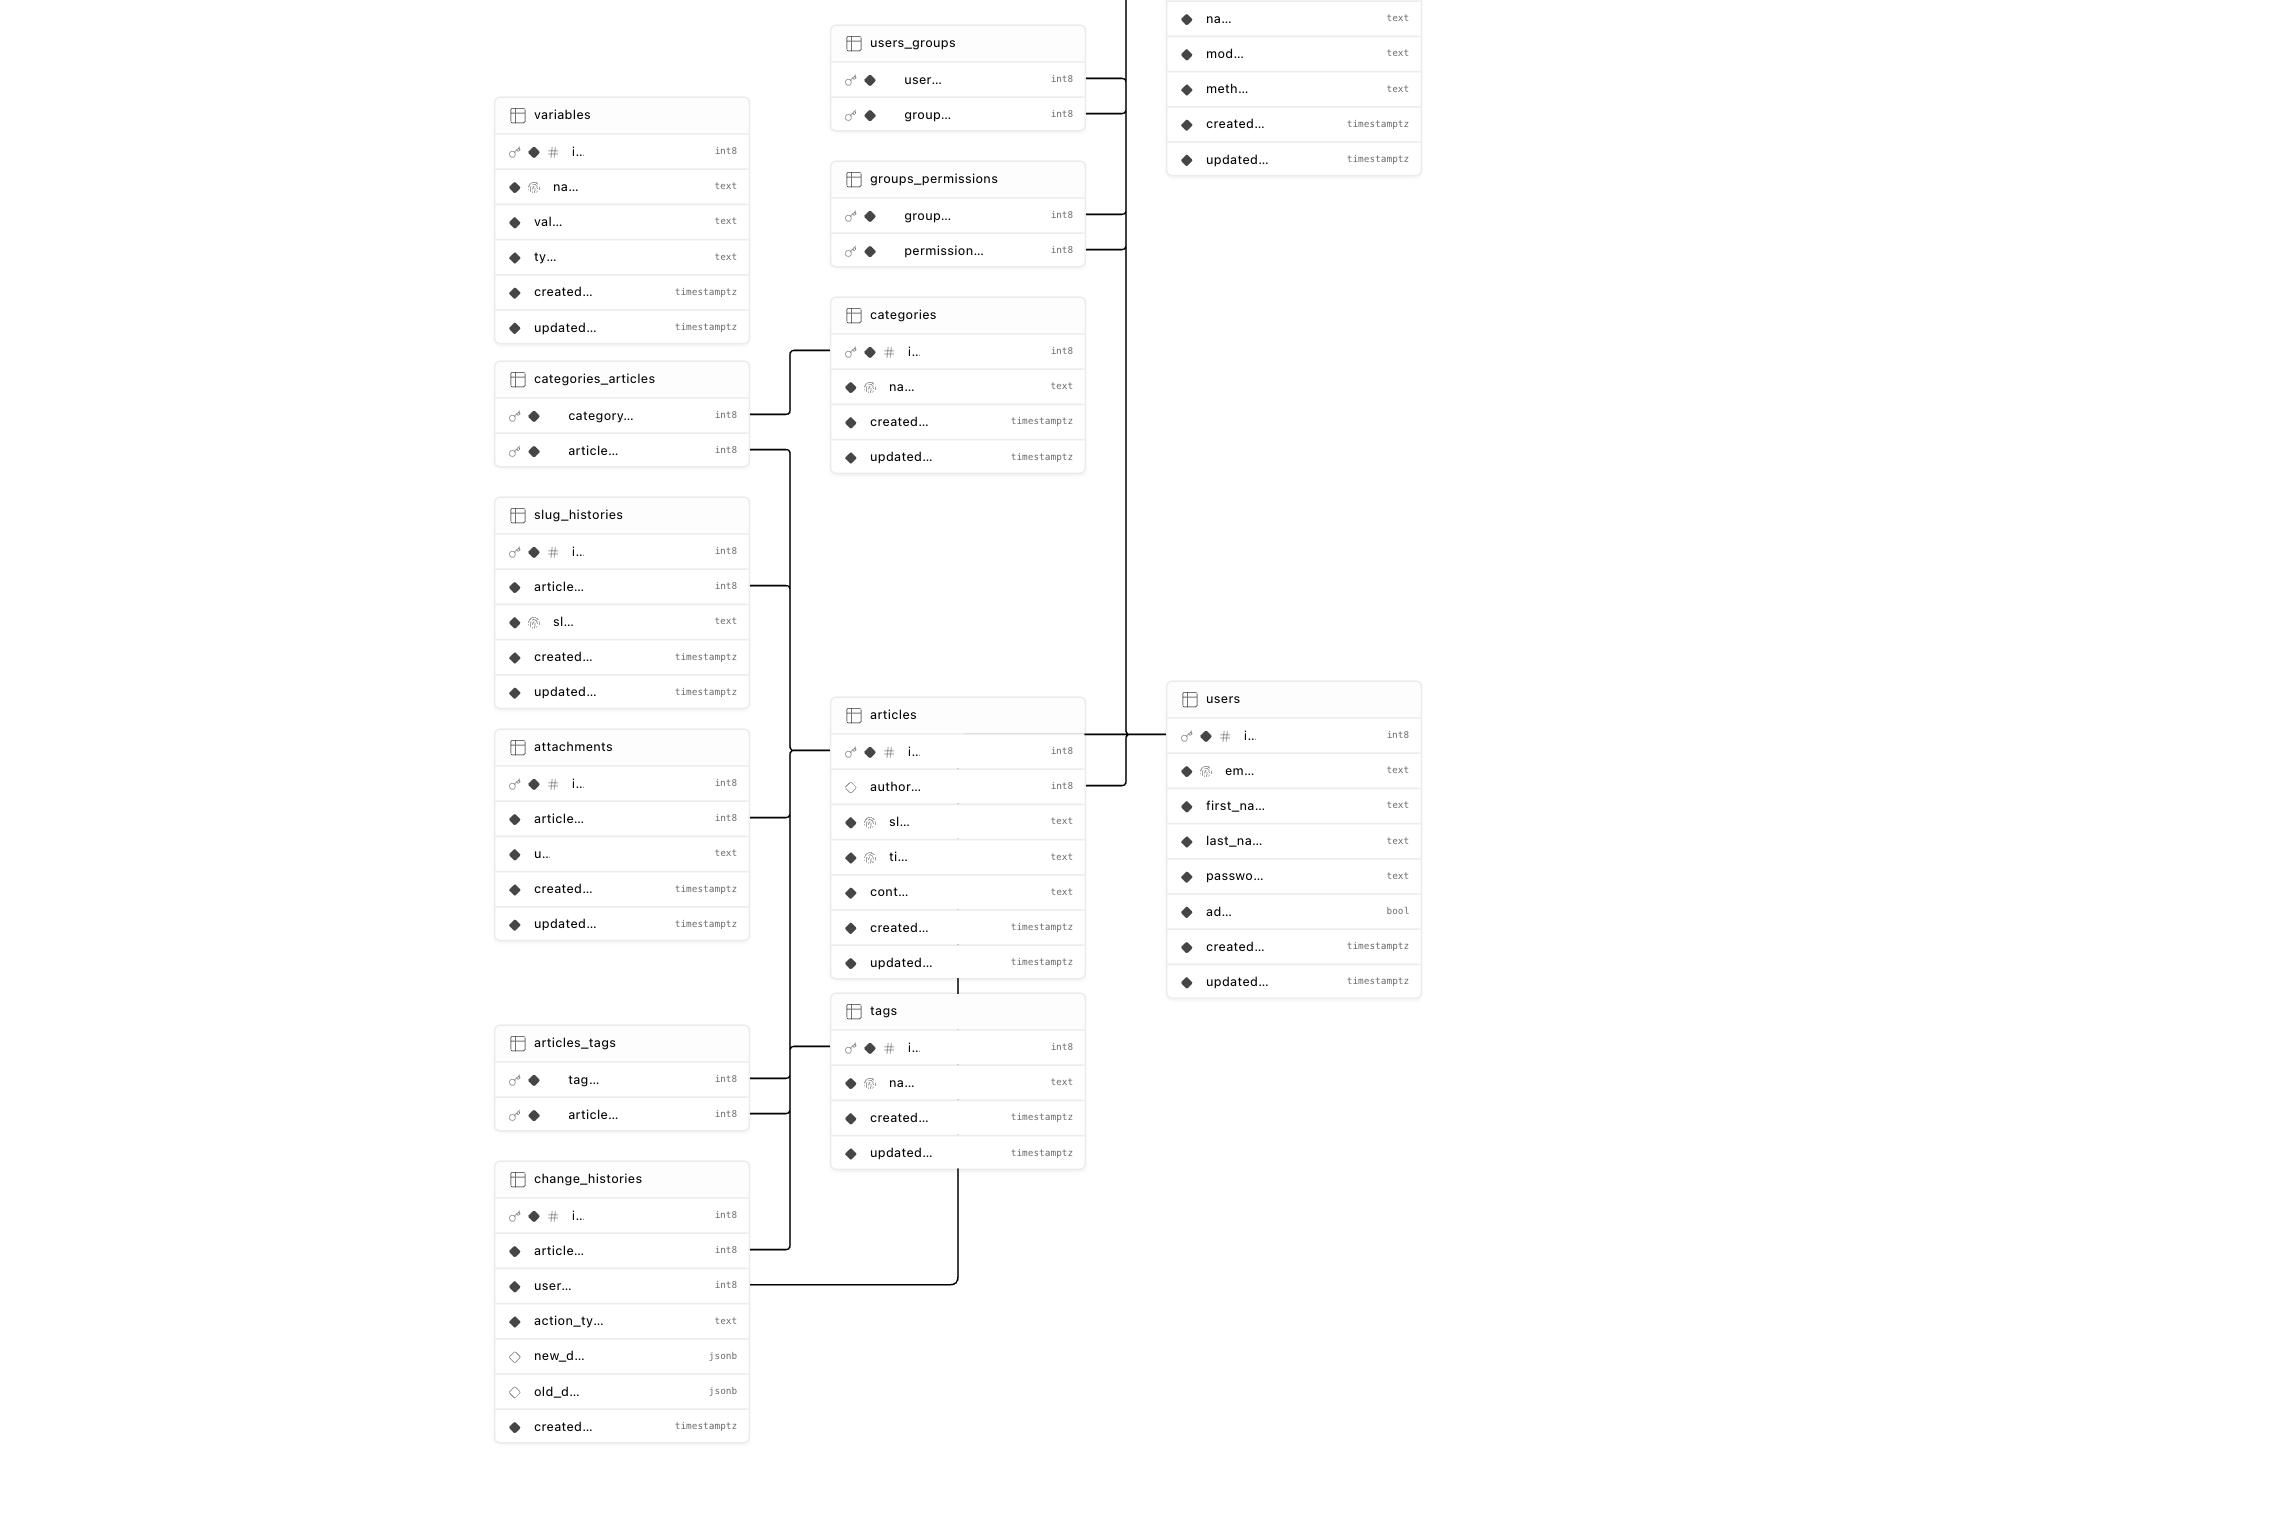
None of this is a flaw in Supabase - the dashboard’s job is administering the project, not holding your data model. The mistake is asking a dashboard widget to be the schema diagram your team keeps, a job it was never built for.
How do I get an ER diagram of my Supabase database?
Underneath every Supabase project is a plain PostgreSQL database, and that is the door to walk through. Any tool that can reverse engineer Postgres can diagram a Supabase project - the only Supabase-specific part is picking the right connection string.
Open Connect in the dashboard and you will find three strings. They are not interchangeable for a schema tool:
| Connection | Port | Built for | Works for database design software? |
|---|---|---|---|
| Direct connection | 5432 | Long-lived servers | Yes, but resolves to IPv6 unless you have the IPv4 add-on |
| Session pooler (Supavisor) | 5432 | Long-lived connections over IPv4 | Yes - the safe default |
| Transaction pooler | 6543 | Serverless / edge functions | No - connections are reclaimed after each query and session features are restricted |
The session-mode string on port 5432 is the one to use: a schema tool wants exactly one ordinary, long-lived Postgres connection, and session mode provides it over IPv4 from anywhere. The transaction pooler on 6543 exists for a different problem - thousands of short-lived serverless invocations - and its restrictions are noise you do not need.
In Schemity, Supabase is a first-class connection type alongside PostgreSQL, MySQL, MariaDB, SQL Server and SQLite: paste the session string, test the connection before saving it, and the password goes into your operating system’s keychain rather than any config file. Tag the connection with its environment - Local, Staging, Production - so the list stays scannable as projects accumulate. Then reverse engineer the schema into an ERD: every table arrives with its foreign keys drawn as crow’s foot relationships, and the detail the dashboard never shows is on the entity itself - unique constraints as underlined badges, IN check constraints marking enum-like fields, defaults and nullability printed next to each column. Views and materialized views come across too, rendered as read-only entities with italic names - which matters on Supabase, where views shape what PostgREST exposes as your API.
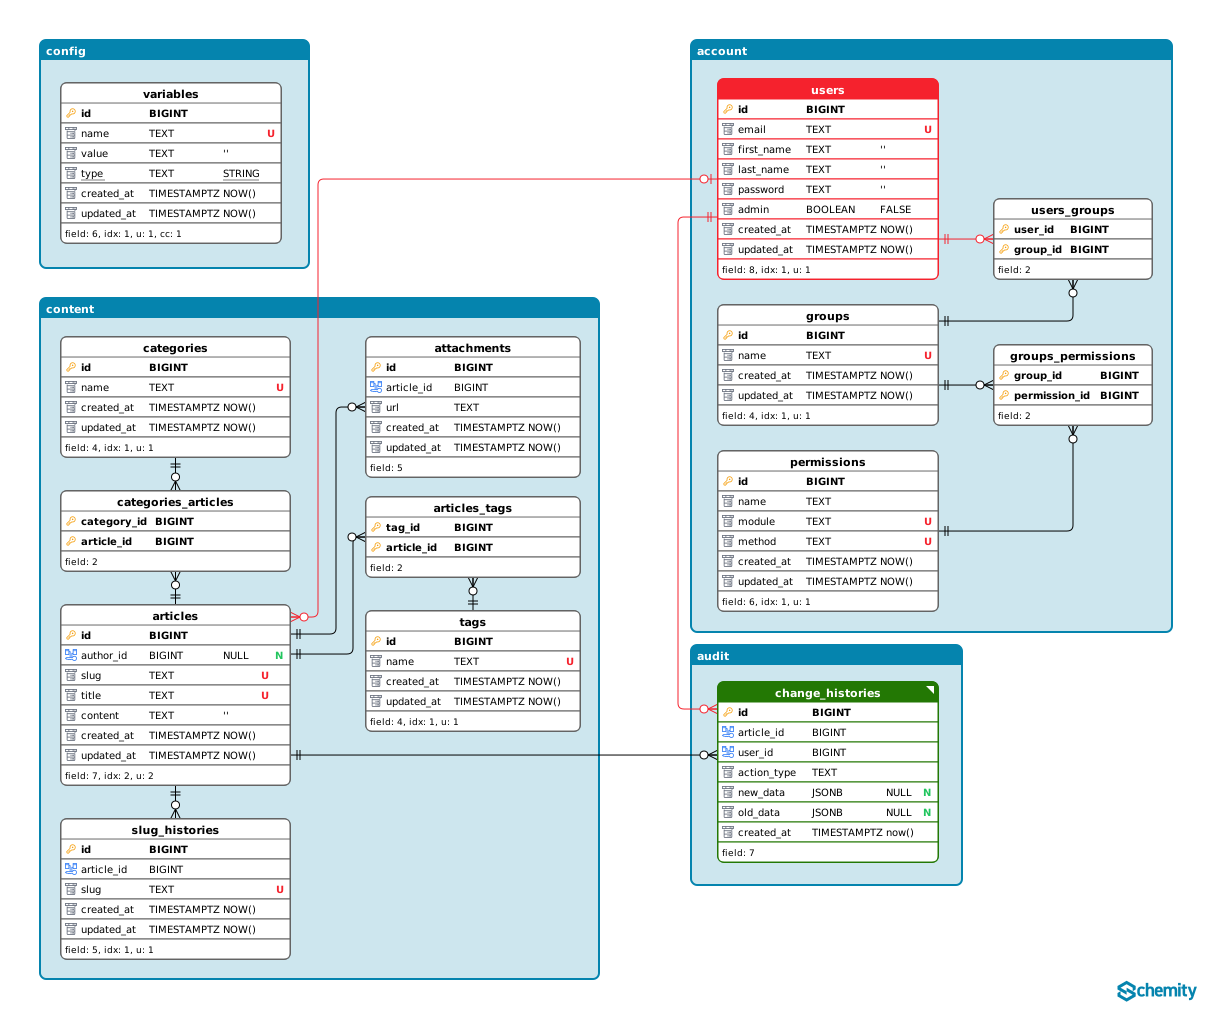
Because this is database design software reading your database directly, the workflow also survives the situations the dashboard cannot: the diagram opens offline on a flight, and the schema of a client’s project never transits any third-party diagram cloud on the way to being documented.
The layout you arrange is the part you own
Reverse engineering gives you the truth; arranging it gives you the understanding. Drag the auth-adjacent tables together, group each domain under a colored legend, route the lines until the picture reads top to bottom - this is analysis work, and in the Studio visualizer it stays locked inside one browser’s localStorage.
Schemity persists it structurally. The diagram is a plain JSON file in a folder on your machine, which means the ERD can live in your Git repository and the layout is versioned along with the model. When the schema changes - and on a Supabase project it changes every time you run a migration or click through the Table Editor - re-sync pulls the fresh schema on reopen while every entity you arranged keeps its position. New tables appear ready to drag into place; dropped ones vanish. The live database stays the source of truth for structure, and you stay the source of truth for the picture.
One diagram also does not have to carry everything. A context view is a focused sub-diagram that displays a chosen subset of the main diagram while the main view remains the single source of truth. Carve one per domain - orders, billing, content - and an orange dot on any entity signals a relationship pointing outside the view, so the focused picture never silently lies about coupling. For a project whose public schema has grown past what one canvas can say, that is the difference between a diagram people open and a wall poster people avoid.
Getting the diagram back out
The last thing a dashboard viewer cannot do is hand the picture to someone else, and it is where an owned file pays off repeatedly. Schemity exports the main view or any context view as SVG - sharp at every zoom level - as well as PNG and JPG for chat threads, and full SQL DDL when the question is really about the statements. It also exports a Mermaid erDiagram, which GitHub, GitLab, Notion and Obsidian render natively: the Supabase schema diagram in your README becomes text that renders as a diagram, reviewable in the same pull request as the migration that changed it.
The dashboard visualizer answers “what does the schema look like right now, while I am logged in.” A reverse-engineered, re-synced, Git-versioned ERD answers the better question - “what is our data model, and how has it changed” - and answers it for the whole team, indefinitely. Point the tool at the database once, arrange the picture once, and the diagram stops being a second job without ever going stale.
Frequently asked questions
Which Supabase connection string should I use for database design software?
Use the session mode string on port 5432. A schema tool wants one plain, long-lived Postgres connection, which is exactly what session mode provides, and it works over IPv4. The transaction pooler string on port 6543 is built for serverless applications - it hands connections back after each query and restricts session-level features, which desktop tools may rely on. The direct connection also works, but it resolves to IPv6 unless your project has the IPv4 add-on.
Can the Supabase Schema Visualizer show auth and storage together with public?
No. The visualizer renders one schema at a time, so public, auth, storage and graphql_public are each a separate picture. Community tools exist specifically to work around this. A complete diagram of what you care about requires connecting a tool to the database itself and choosing what to include.
Does reverse engineering a Supabase database change anything in it?
No. Reading the schema is a read-only operation - the tool queries the catalog tables and draws what it finds. In Schemity, nothing is ever written to the database unless you edit the diagram and explicitly apply the generated migration SQL after reading it.