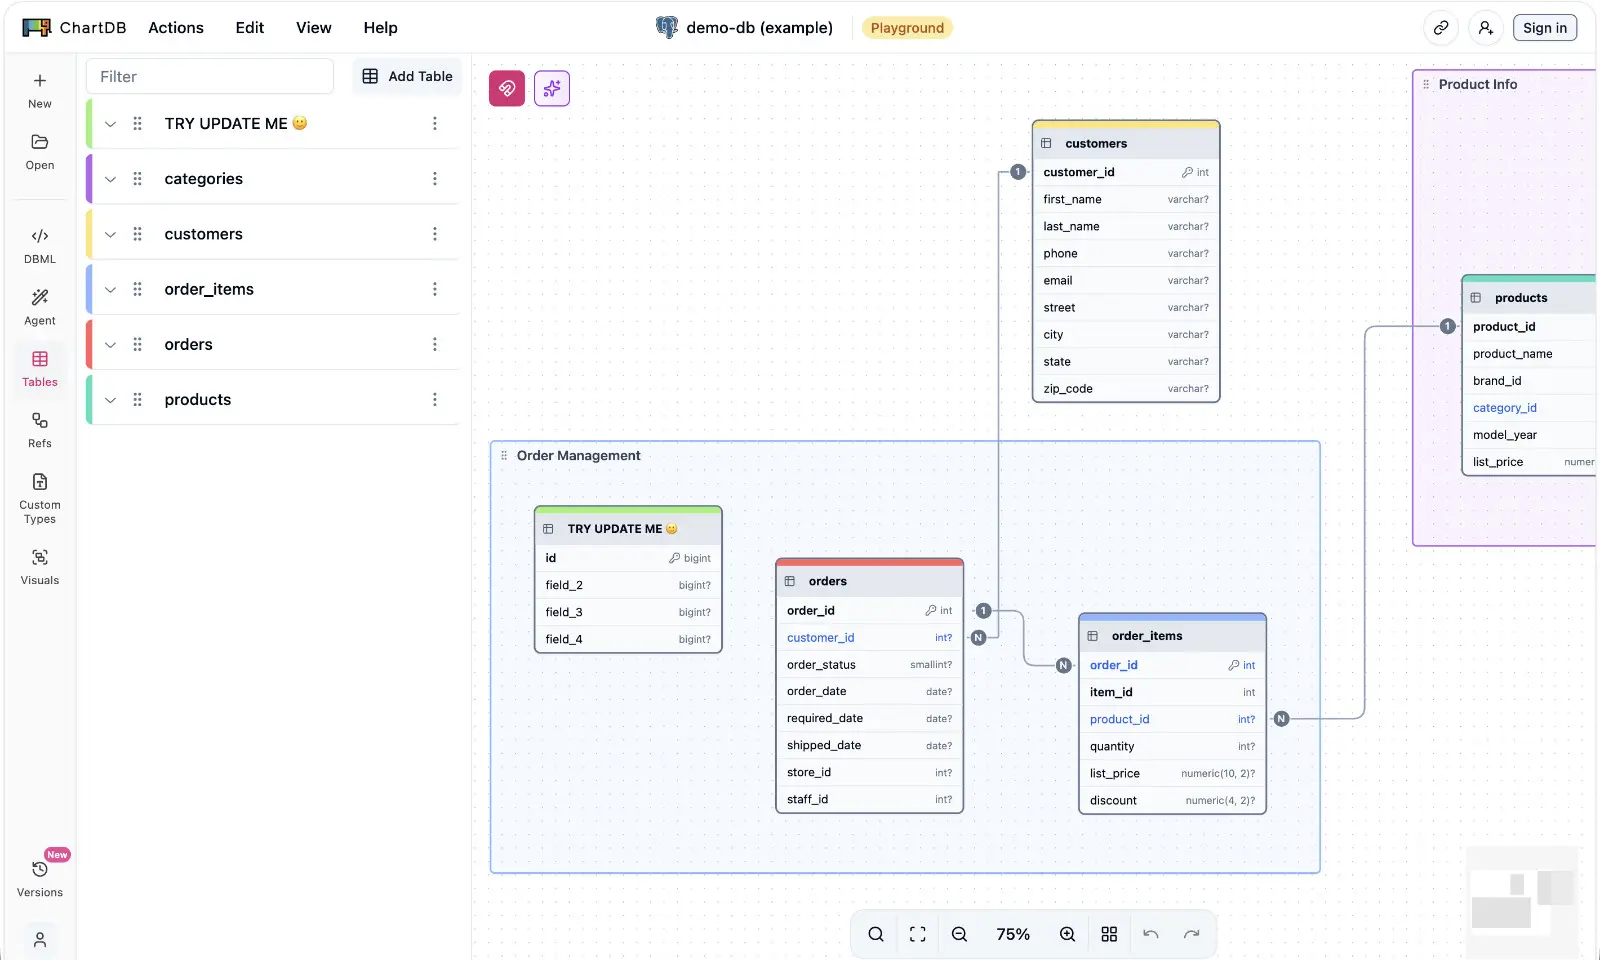
ChartDB nailed something real - run a query, get a diagram, share a link, with an AI assistant on top - and Schemity is its offline desktop counterpart: a ChartDB alternative that keeps diagrams as local JSON files, lets your own AI agent work on the schema through a local MCP server, and costs $129 once instead of a subscription. The difference is not polish. It is where your schema physically goes.
That difference bites when a certain kind of engineer hits a certain kind of wall: the schema you want to diagram is the one you are not allowed to upload. The client’s NDA, the IT policy, the compliance checklist - somewhere in there is a sentence that ends the conversation with any browser tool: project data does not go to third-party servers. This article is for the engineers who love what ChartDB does and cannot use it where it does it.
The Honest Summary
ChartDB is a polished, web-based schema visualizer with an open-source core. Fast import from a dozen databases, real-time collaboration, AI-assisted layout and export, link-based sharing. If your schema is not sensitive and your team lives in the browser, it is genuinely good.
Schemity is the ChartDB alternative for when the diagram has to stay on your machine. Database design software - offline by architecture, not by settings toggle - where diagrams are plain JSON files in your Git repo, your own AI agent connects through a local MCP server, and schema changes flow back to the database as reviewed SQL migrations.
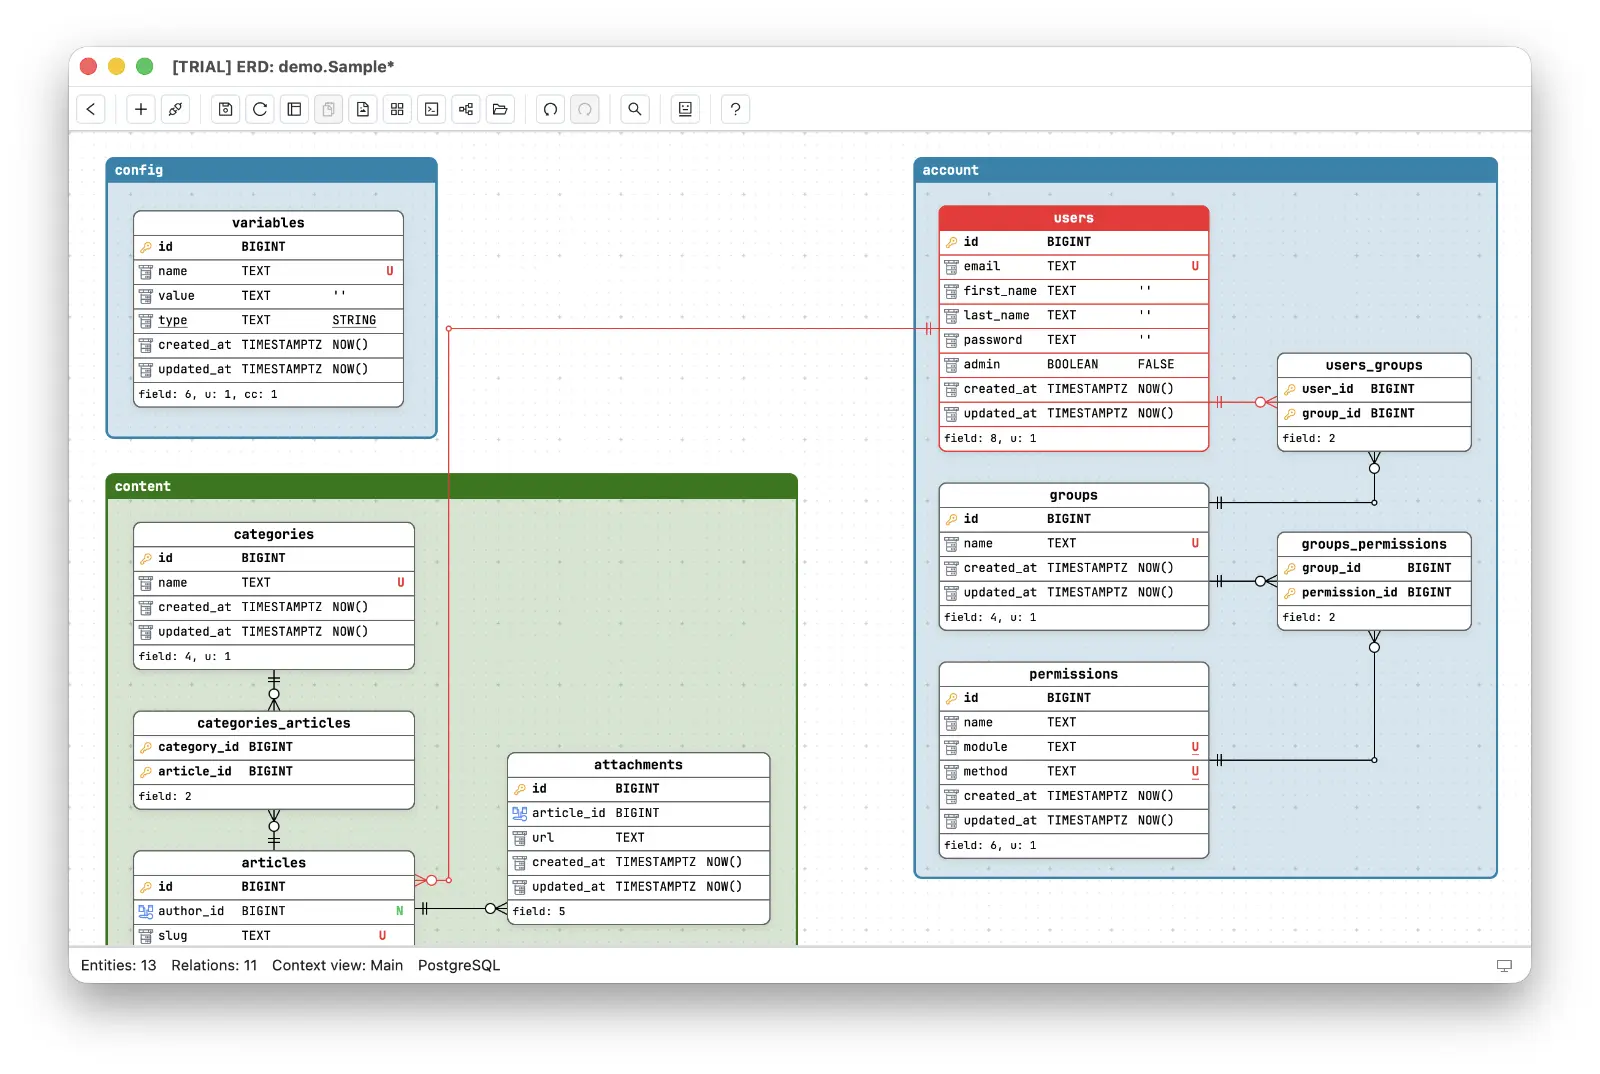
The difference is not feature count. It is where your schema physically goes.
Side-by-Side
| ChartDB | Schemity | |
|---|---|---|
| Platform | Browser (cloud app, self-host option) | Native desktop (macOS, Windows, Linux) |
| Open source | Yes: AGPL-3.0 core | No: proprietary, one-time license |
| Where diagrams live | Their cloud; self-hosted: your browser’s storage | Your machine, plain JSON files |
| Offline | No (cloud); self-hosting still means running a web stack | Full offline, air-gap ready |
| Git workflow | Export-based | Native: the ERD is a JSON file in your repo |
| AI | Cloud AI (hosted); own OpenAI key or custom endpoint (self-hosted) | Local MCP server: Claude Code, Cursor, or any MCP host reads the schema and stages edits you review |
| Live DB connection | Import via query or connection | Direct or SSH tunnel; passwords in the OS keychain |
| Schema changes | Export DDL | Reviewed SQL migration diff, applied only when you approve |
| Databases | PostgreSQL, MySQL, SQL Server, SQLite, MariaDB, and more | PostgreSQL, Supabase, MySQL, MariaDB, SQL Server, SQLite |
| Image export | PNG, JPG, SVG at 1x-4x, scoped to the current viewport | PNG, JPEG, SVG of the whole diagram or any context view |
| SVG in a vector editor | An HTML snapshot in a foreignObject wrapper - opens blank in Affinity Designer, Illustrator, Inkscape | True vector: shapes grouped per entity, table and field names still live text |
| Collaboration | Real-time multi-cursor, link sharing | Deliberately single-designer: feedback via review - meetings, read-only sharing, PRs |
| Pricing | Subscription tiers by seats, databases, and tables per database (from $25/month, up to 40% off billed yearly) | $129 one-time, no subscription, no caps |
Where ChartDB Wins
Credit where due - ChartDB is the strongest entry in the cloud generation of database design software.
Zero-install onboarding. It is a URL. Paste a query result, see a diagram. For a quick look at a non-sensitive schema, nothing is lighter.
Real-time collaboration. Multiple cursors on one diagram, live syncing, public and private sharing links. If your team’s workflow is “everyone in the same doc at once”, ChartDB has built that and Schemity has not - though, as a later section explains, that absence is a choice, not a backlog item.
A genuinely open-source core. ChartDB’s core is AGPL-3.0 on GitHub. You can read the code, run it as a single Docker container, and point its AI features at your own OpenAI key or even a custom inference endpoint. That is a real trust signal - Schemity, a proprietary app, cannot match it and should not pretend otherwise.
Momentum. ChartDB ships fast and markets well, especially around AI. If you want the tool your teammates have already heard of, this is it.
Where ChartDB Hits Its Ceiling
The cloud is the product. The hosted app is where the polish, the collaboration, and the AI live - and it is a third-party server holding your schema. A schema is not just structure; table names alone sketch your product roadmap. For an NDA project or an IT-reviewed environment, “we upload the data model to a SaaS” is the sentence that gets the tool rejected, however good the tool is.
AI happens on someone else’s terms. ChartDB does AI loudly, and in the hosted product the AI features run cloud-side - your schema travels through their stack to reach a model. That is precisely the path a confidential schema cannot take.
The meter is your schema. ChartDB’s plans are capped by seats, by number of databases, and by tables per database - the solo plan covers one database up to 100 tables. A diagram is read by many more people than edit it, and a schema grows whether or not the budget meeting approved it; on a metered plan, both of those facts are billing events.
The image export is a screenshot of the browser. ChartDB exports PNG, JPG and SVG, and its own docs note the caveat that comes with rendering a web canvas: “The exported image is based on the current view in your viewport. Make sure you have zoomed and panned your diagram to show the desired tables and relationships before exporting.” The SVG carries a second, quieter limitation. ChartDB’s repository is AGPL and public, so the mechanism is not a matter of opinion: package.json lists html-to-image, and src/context/export-image-context/export-image-provider.tsx imports toJpeg, toPng, toSvg from it and maps the svg format straight to toSvg. That function does not draw vector geometry - it wraps a snapshot of the DOM in a single foreignObject tag. Browsers render it; almost nothing else does, which is why such a file opens blank in Illustrator, Inkscape and most converters. The 1x-4x scale factor offered next to the SVG option is the tell: a true vector export has no resolution to choose.
“But you can self-host it” answers the first objection, so it deserves more than a bullet point.
Can You Self-Host ChartDB?
Yes, and it is the strongest version of the ChartDB privacy story, so let’s give it its due. The core is AGPL-3.0, it runs as one Docker container - docker run -e OPENAI_API_KEY=<key> -p 8080:80 ghcr.io/chartdb/chartdb:latest - and the AI features accept your own OpenAI key or a custom inference endpoint, set at build time through VITE_OPENAI_API_ENDPOINT and VITE_LLM_MODEL_NAME. A self-hosted instance can therefore keep both your schema and your AI prompts off ChartDB’s servers. For a team with a platform group that already runs internal tools, that is a legitimate setup.
What self-hosting costs you is not a matter of opinion either - ChartDB documents it. Its cloud vs self-hosted comparison lists team features (private diagrams, user sharing, versioning), programmatic sync of database changes to diagrams via API, and embedding interactive diagrams as cloud-only. Self-hosted has “no built-in user accounts”, and diagrams are shared “manually via export/import”. So the self-hosted build is the single-player build, by design and by the vendor’s own description.
Three things remain true after you self-host, and they are the reasons this comparison still has two columns.
Your diagrams live in a browser, not in files. The standard self-hosted container ships no storage backend - it serves the application, and your diagrams persist in the browser’s local storage. That has sharp edges: diagrams are tied to one browser profile on one machine, clearing site data deletes your work, and there is nothing on disk to commit. The ERD-in-Git workflow - plain JSON files, pull requests, git log as your version history - is not an export step away; it is not part of the architecture. Schemity starts from the opposite premise: the file on disk is the diagram.
You now operate a web service to draw diagrams. The container is easy to start and yours to keep running - upgrades, backups of what the browser holds, the URL your teammates bookmark. That is a fine trade for a company with infrastructure habits. It is a bad trade for the people with the strictest confidentiality requirements - consultants and small teams on client sites - who need the diagram tool to work on a laptop, on a plane, inside someone else’s network. Database design software is self-hosting reduced to its useful core: the software runs on hardware you control, with none of the service to maintain.
The single-player version competes with a desktop app. Real-time collaboration, sync, and shared version history are the hosted product’s value. Self-hosted ChartDB used by one engineer at a time is playing the same game as Schemity - local-ish, private, single-user - at which point the comparison is direct: browser storage vs plain JSON in Git, an AI feature built into the web app vs an MCP server your own agent connects to, DDL export vs a reviewed migration diff applied to the connected database.
One more honesty note, in the other direction: ChartDB is open source and Schemity is not. If auditable source is a hard requirement, that is a genuine point for ChartDB. Schemity’s trust story is architectural instead - database design software whose files sit in your own repo, observable in the most basic way: unplug the network and everything still works.
No Shared Cursors - a Choice, Not a Gap
It would be easy to read the collaboration row of the table as a feature Schemity has not gotten to yet. It is the opposite: Schemity believes real-time co-editing is wrong for database design, and built accordingly.
Schema design is some of the most concentration-heavy work in software. The designer is holding an entire model in their head at once - which entity owns which fact, where the boundaries sit, what cascades if this relationship changes, which constraint encodes which business rule. That mental state takes an hour to build and one interruption to lose. Now picture the multi-cursor version of it: mid-thought, a colleague renames the field you are reasoning about, or moves the entity your eyes were resting on. Every live edit by someone else forcibly swaps their model into your head. A designer spending all their mental energy on the model cannot afford that, and no amount of cursor-presence UI makes it affordable.
So Schemity is built around a different loop: one designer in charge of the diagram, and feedback at moments the designer chooses. Walk the team through the design in a meeting or a screen share and collect reactions. Hand colleagues the diagram read-only, so they can study it without being able to move a single field. Commit the JSON and open a pull request, where comments arrive as comments - and the designer decides what changes. This is how teams already collaborate on code: nobody types into your editor while you work; they review your diff. A schema - the ERD single source of truth for the whole system - deserves at least that much protection.
If everyone-in-the-file is genuinely how your team works, ChartDB serves that honestly and Schemity will not try to. But it is worth asking which schema decisions you are proud of: the ones made with an audience editing alongside you, or the ones one person thought hard about and then defended in review.
AI With Nobody Else in the Loop
This is the sharpest difference, because it is the territory ChartDB is famous for.
ChartDB builds AI into the product. Schemity does the opposite: it runs no model of its own and is instead an MCP server for the agent you already use - Claude Code, Claude Desktop, Cursor, or any other MCP host. The server listens only on your machine. Through it the agent reads the schema, context views, dependencies, and lint findings, and stages diagram edits that you review in History before saving. The schema goes where your agent already sends your code, and nowhere else - no diagram vendor in the middle, no second company logging it. That is private AI database design in the sense that survives an IT review: there is no new AI vendor to approve.
And the agent is not a sidebar that emits text. Describe a subsystem and it stages the entities and relationships on the canvas; ask what a pending migration would cost and it runs Schemity’s impact analysis to answer. What it never gets is database credentials: nothing an agent does writes to a database, and a migration only runs from your own click. Where no cloud model is allowed at all, connect an agent host that runs a local model to the same server, and the loop has zero egress.
The Diagram That Belongs to Your Repo
ChartDB keeps version history inside its platform. Schemity’s answer is more boring and more durable: the diagram is a plain JSON file in a folder, so version control is whatever your team already uses. Commit the ERD next to the code it describes, review schema changes as pull requests, and diff last quarter’s model against today’s with git log - database design software workflow with no vendor between you and your own history.
The same architecture answers the trust question without a policy document. Database design software with JSON storage has nothing to leak: no account, no sync, no server component. Connections to real databases go direct or through an SSH tunnel, passwords stay in the OS keychain, and when a teammate needs to read a diagram, you share the file - they open it read-only, no database credentials required.
And when design needs to become reality, Schemity closes a loop ChartDB leaves open: change the ERD and it generates the SQL migration diff for you to review - you decide whether to apply it, and only then does anything run against the connected database.
How Much Does ChartDB Cost?
ChartDB is free for one database of up to 10 tables. Past that, Pro is $25/month and Teams is $59/month for up to three people. Schemity is $129 once. Here is the full picture, taken from ChartDB’s pricing page in August 2026 at its default monthly billing:
| Plan | Monthly | Seats | Databases | Tables per database |
|---|---|---|---|---|
| Free | $0 | 1 | 1 | up to 10 |
| Pro | $25/month | 1 | 1 | up to 100 |
| Teams | $59/month | up to 3 | up to 5 | up to 200 |
| Custom | contact sales | negotiated | negotiated | negotiated |
Yearly billing is advertised at up to 40% off; ChartDB does not publish the resulting per-plan rates, so the monthly figures above are the ones you can actually verify.
Schemity: $129 one-time, optional $69/year for updates. Database design software without subscription - and without meters: no seat counting, no database quota, no table cap (1,035 tables measured). Stop renewing and everything keeps working, because the app and the files are both on your machine.
Run the numbers. The free tier ends at ten tables in one database, which almost any real schema passes in its first week - so for professional work the honest comparison starts at Pro. A solo engineer on Pro pays $300 a year, every year, for one database capped at 100 tables, and production schemas cross 100 tables sooner than anyone plans for. Schemity costs $129 once, so it pays for itself against Pro in about five months. A three-person team on Teams pays $708 a year; three Schemity licenses are $387, once.
But the arithmetic is the smaller point. Look at what the meters measure: your schema. On ChartDB, adding the eleventh database or the 101st table is a billing event - the natural growth of the thing you are designing walks you up a pricing ladder. Database design software inverts that relationship: the tool has to keep earning its place on your machine, and your schema is free to grow without asking the pricing page for permission.
Who Should Use ChartDB
- Your schema is not confidential and a browser link is the fastest way to share it
- Real-time multi-cursor collaboration is central to how your team works
- You want a free, open-source visualizer for occasional quick looks
- You have the appetite to self-host a web app and maintain it
Who Should Use Schemity
- The schema is under NDA, client-owned, or IT-reviewed - it cannot live in a SaaS account
- You work offline, behind a VPN, or need database design software
- You want your own AI agent working on the data model through a local server, not a vendor’s cloud
- Your ERD should live in Git next to your code and evolve through pull requests
- You want design changes to become reviewed SQL migrations, not exported files
- You prefer owning your tools: one purchase, database design software, no seats to count
The Bottom Line
ChartDB is the best of the database design software. That sentence contains both the compliment and the constraint.
If your schema is free to travel, ChartDB will treat it well. If your schema cannot leave your machine - and for consultants, NDA projects, and IT-governed teams, it cannot - then the question is not which cloud tool to pick. It is which ChartDB alternative works offline without giving up the modern parts: the live database import, the AI assistance, the polish.
That is the tool Schemity was built to be.
Looking at other alternatives?
- Prefer a DSL-based sketch pad? See Schemity vs dbdiagram.io.
- Weighing a desktop database IDE? See Schemity vs DbSchema.
- Coming from a general diagramming suite? See Lucidchart ERD alternative.
- Hitting a table cap in a cloud editor? See DrawSQL alternative.
Frequently asked questions
How much does ChartDB cost?
ChartDB is free for one database of up to 10 tables. Pro is $25/month for one person, one database, and up to 100 tables. Teams is $59/month for up to three people, five databases, and up to 200 tables each. Yearly billing is advertised at up to 40% off, though ChartDB does not publish the resulting rates. Prices checked August 2026.
Is ChartDB free?
There is a free tier, capped at one user, one database, and 10 tables. That is enough to try it out but not enough for a real schema, so professional use starts at the $25/month Pro plan.
Can you self-host ChartDB?
Yes. The core is AGPL-3.0 and runs as a single Docker container from ghcr.io/chartdb/chartdb, and its AI features accept your own OpenAI key or a custom inference endpoint, so a self-hosted instance can keep both your schema and your prompts off ChartDB's servers. ChartDB's own cloud vs self-hosted documentation lists team features, private diagrams, versioning, API sync and embedding as cloud-only, and states that self-hosted has no built-in user accounts and shares diagrams manually via export/import.
Where are diagrams stored in self-hosted ChartDB?
In the browser, not in files. The standard container serves the application without a storage backend or user accounts, so diagrams persist in the local storage of the browser you drew them in - tied to one browser profile on one machine, deleted if you clear site data, and with nothing on disk to commit to Git. This is the practical difference between self-hosting a web app and database design software, where the file on disk is the diagram.
What is the best offline alternative to ChartDB?
Schemity is database design software that runs entirely offline: diagrams are plain JSON files on your machine that you can version control with Git, AI agents connect through a local MCP server, and it is a $129 one-time purchase with no seat, database, or table limits. It is the closest offline counterpart to ChartDB for engineers whose schemas cannot be uploaded to a cloud service.