
A database view belongs in your ERD, but not disguised as a table: it is a derived, read-only relation, and the diagram should say so at a glance. Schemity draws views and materialized views as read-only entities with italic names - present on the canvas, visually distinct from the base tables they are built on.
That sentence would be unremarkable if the rest of the tooling world agreed with it. Mostly, it does not. In most database design software your views are simply absent, and in the rest they are dressed up as something they are not.
The reporting layer your diagram pretends does not exist
Views are not decoration. They are where schemas put their public face: the reporting layer that joins five tables into one readable relation, the security boundary that exposes a subset of columns to an application role, the compatibility shim that survives a refactor. On Supabase, views are how you shape what PostgREST exposes as an API. A materialized view may be the single most performance-critical object in an analytics schema. Whoever reads your diagram to understand the system needs to see them.
Yet the diagram usually cannot show them. DBML - the schema language behind dbdiagram.io - has no syntax for views at all: a user proposed designing views with join definitions in December 2022, others were still upvoting the request in July 2024, and there has been no official reply. SSMS database diagrams accept tables only. And ChartDB, the most active cloud schema visualizer, shipped view support only in v1.15 in August 2025 - a year into the product’s life - having earlier demonstrated the opposite failure mode: before views were modeled properly, you could draw a foreign key pointing into a view, which is exactly the kind of nonsense a diagram produces when it cannot tell a derived relation from a base table.
So the designer documenting a real schema gets a choice: leave the views out and hand readers a diagram that hides the reporting layer, or smuggle them in as fake tables and hand readers a diagram that lies about what is editable.
| Tool | Database views in the diagram |
|---|---|
| dbdiagram.io (DBML) | Not supported - requested since Dec 2022, no official reply |
| SSMS database diagrams | Tables only |
| ChartDB | Added Aug 2025 (v1.15); earlier versions allowed a foreign key into a view |
| MySQL Workbench | Supported in EER models |
| Schemity | Read-only entities with italic names; importable into context views |
A view drawn like a table is a small lie
The absence is bad; the disguise is worse. A view rendered as an ordinary table invites every wrong conclusion a reader can draw. It implies you could add a column to it the way you would to a table. It implies a foreign key could land on it. It implies its rows live somewhere, when they are a query executed on demand. Materialized views sharpen the trap: they do hold physical rows and can carry indexes, so they look even more like tables - but their columns are still derived, and the way to change one is to change its defining query, not to edit fields in a dialog.
The diagram should encode that difference, not rely on a naming convention (v_ prefixes are a workaround, not a design) or on the reader’s memory of which boxes are real. Schemity uses three signals: views and materialized views are read-only on the canvas, so there is no field editing to be misled by; their names render in italics; and the entity footer says it outright, opening with a bold view or mview token ahead of the usual field and index counts, so nobody is left inferring the kind of relation from a naming convention. The distinction survives at any zoom level and in any export, including the data dictionary document, where views are labelled as views rather than dropped.
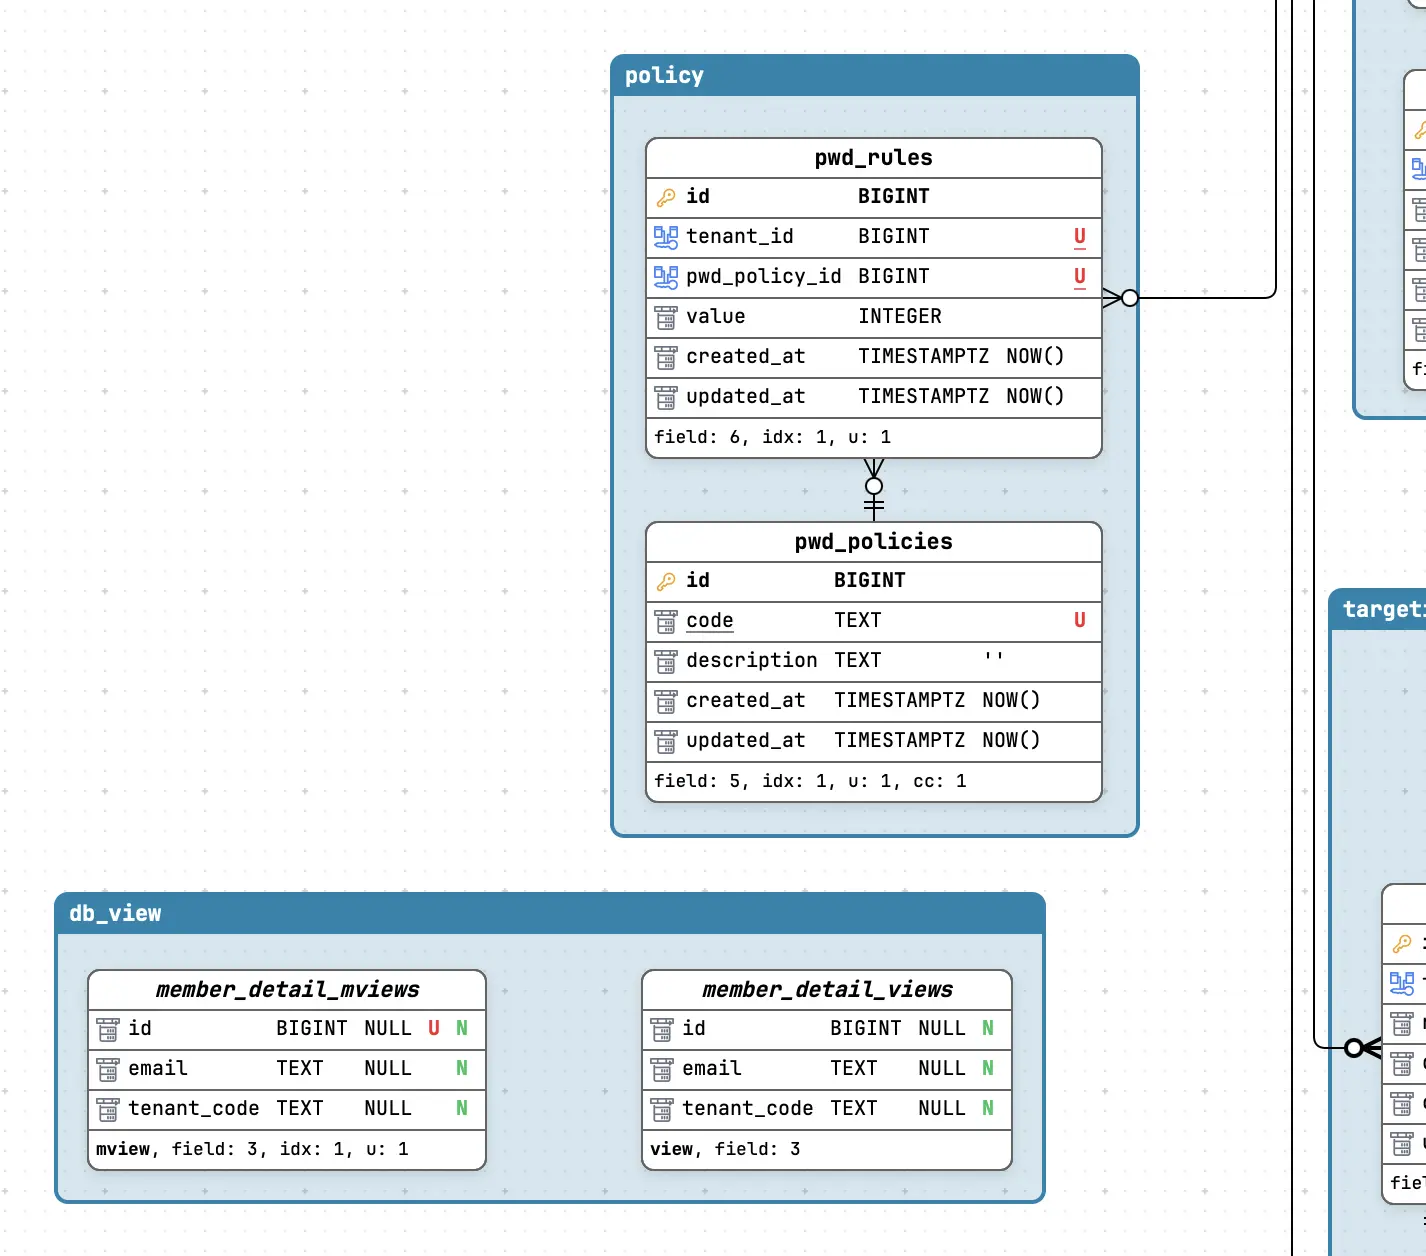 The same philosophy as the bold crow’s foot for ON DELETE CASCADE: a structural fact about the schema deserves a visual channel of its own, one that cannot go stale.
How do I show database views in an ERD?
Open a diagram backed by your database in Schemity - version 2.9.0 or later - and the views are on the canvas alongside the tables - database design software reading the schema from the live database rather than from a hand-maintained model, so the derived layer is documented from the same source of truth as everything else. You arrange them, color them, and group them under legends exactly like base tables; you just cannot edit what is not editable.
The naming collision is worth untangling here, because Schemity also has a feature called context views, and the two are unrelated the way database view and point of view are unrelated. A context view is a focused sub-diagram that displays a chosen subset of the main diagram while the main view remains the single source of truth. Database views - the SQL kind - are entities inside your diagrams, and they can be imported into a context view like any other entity.
That combination is where the feature earns its keep. The reporting layer is usually its own bounded concern: a handful of views over a dozen base tables, consumed by dashboards and exports. Pull those views and their source tables into one context view and you have the reporting layer as a diagram - what feeds what, which base tables are load-bearing, where a refactor will ripple. The same works for a security-boundary story: one context view showing exactly which relations an application role can see, readable by the auditor who asked without a single query.
Views exist because base tables alone do not tell the whole story of a schema. A diagram that omits them - or forges them - tells even less of it. Put them on the canvas, in italics, where they belong.