If you want an ERD tool that reads your database instead of a file you exported from it, Lucidchart is the wrong shape of tool and Schemity is a direct answer: a native desktop app that opens a real connection, pulls the schema, and draws the diagram with foreign keys already wired. Lucidchart can absolutely render an ERD - but every path into it starts with you doing the extraction by hand.
That is not a bug in Lucidchart. It is what happens when a database diagram is one shape library inside a general-purpose diagramming canvas that also draws org charts, flowcharts, and network topologies. The canvas is excellent. It just does not know what a foreign key is until you tell it, and it has no way to go and ask.
The Honest Summary
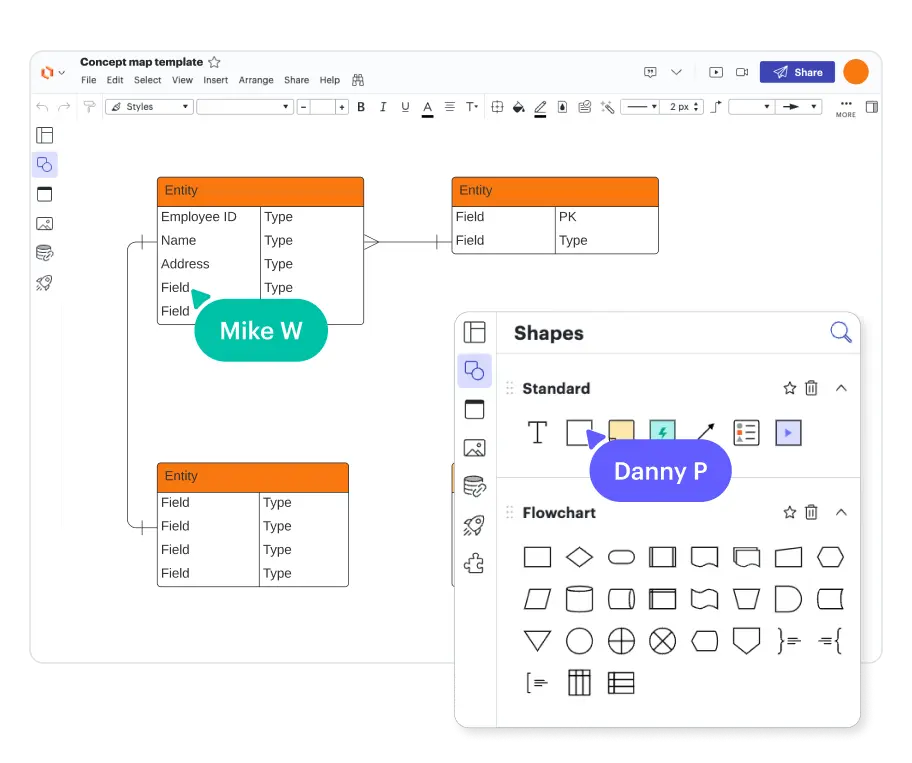
Lucidchart is a browser-based visual collaboration suite with an Entity Relationship shape library. Multiplayer editing, comments, presentation mode, Confluence and Jira integrations, thousands of templates - all of it applies to your ERD the same way it applies to any other diagram. It is priced per seat, from a free tier through roughly $9 per user per month for Individual and up from there, and the free tier caps you at 3 editable documents with 60 shapes per document.
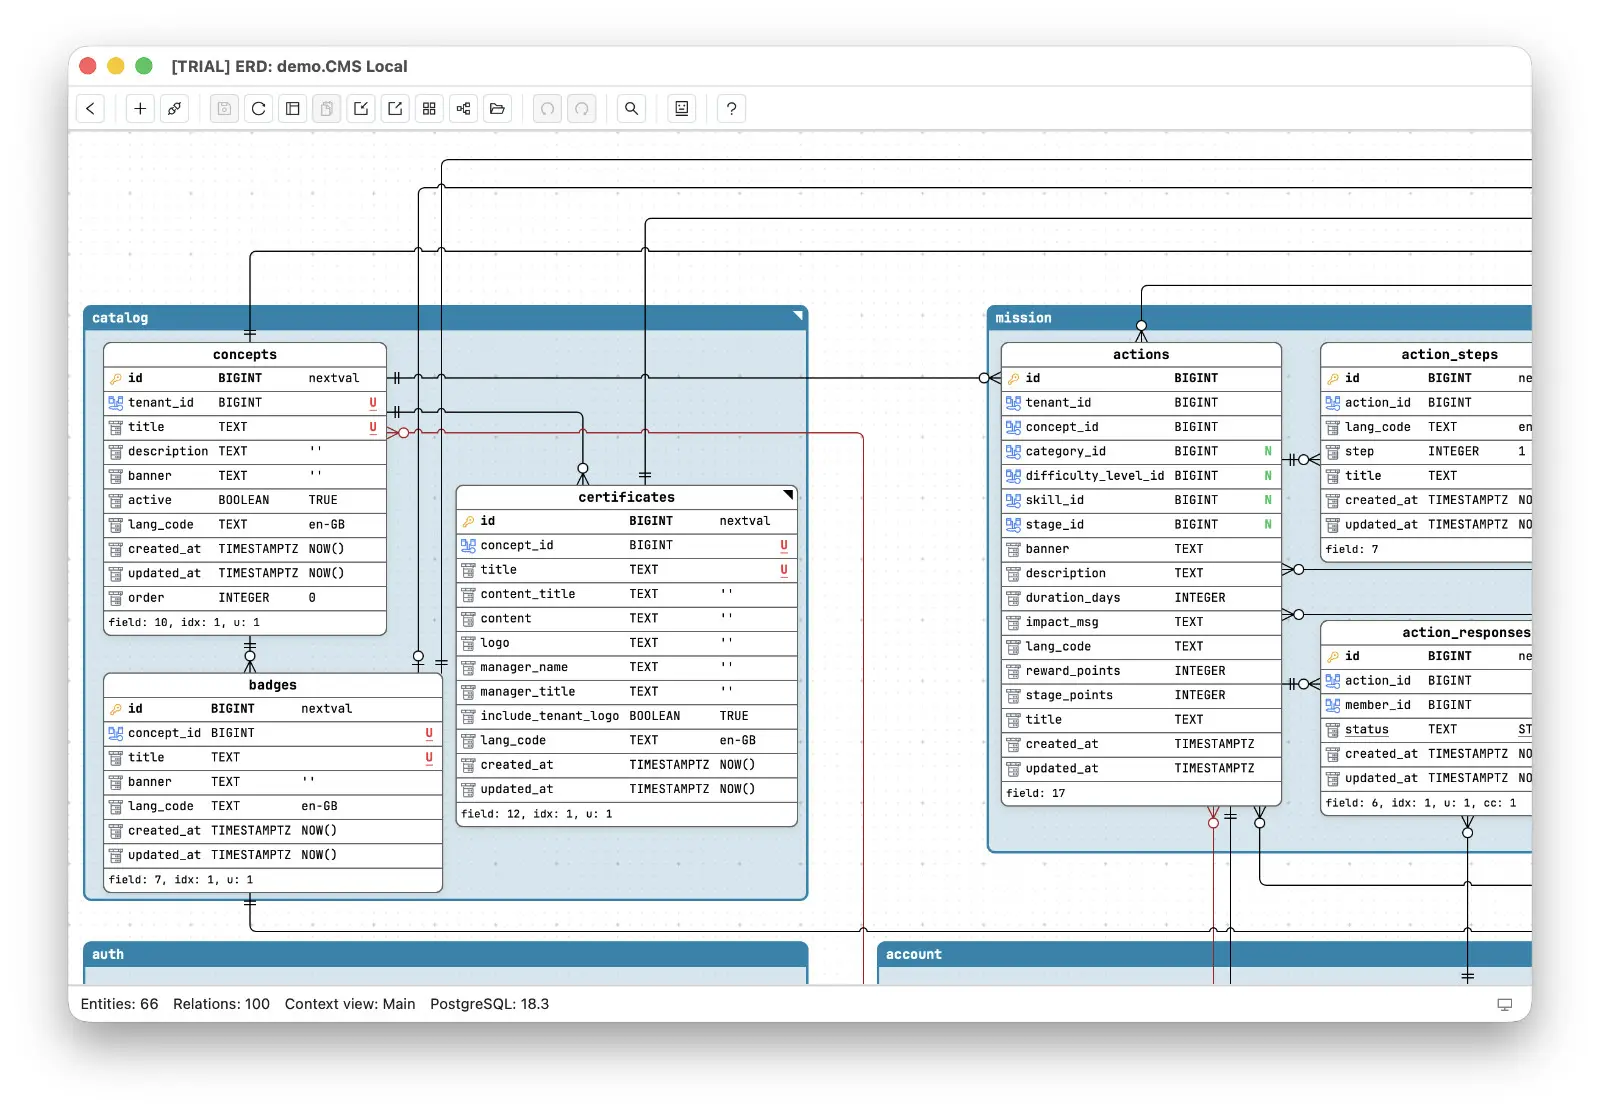
Schemity is an offline ERD tool for software engineers: a native desktop app that connects to PostgreSQL, Supabase, MySQL, MariaDB, SQL Server, and SQLite, reverse engineers the live schema into a diagram, generates the SQL migration diff when you change the model, and stores everything as plain JSON files you keep in Git. One $129 purchase, no account, no seats.
The distinction that matters is not cloud versus desktop. It is whether your diagram tool has a connection to the thing it is diagramming.
Lucidchart Cannot Connect to Your Database
The clearest statement of this comes from Lucid’s own community forum. Asked whether there is a way to connect to a DB via ODBC/JDBC to reverse-engineer a schema into a Lucid ERD, the answer was that the database in question is not supported for ERD import, followed by the standing workaround: you could write a custom query and run it in your database if you’d like.
Read that as a workflow and it is a chore with several failure points. You write a query against information_schema in the exact shape Lucid’s importer expects. You run it. You export the result as TSV or CSV. You upload the file. If anything about the output is off, you get a parse error and start again. Lucid has expanded the list of engines its importer understands - MySQL, PostgreSQL, Oracle, SQL Server, plus newer additions like Snowflake, Redshift, BigQuery and Azure SQL - but the mechanism underneath is still file upload. There is no connection to test, no credentials to store, nothing that can be re-run tomorrow when the schema has moved.
Schemity starts at the other end. You create a connection, directly or through an SSH tunnel, test it before saving, and Schemity reverse engineers the schema into an ERD - tables, fields, types, defaults, constraints, and the foreign keys as actual crow’s foot relationships. Passwords go into the operating system keychain, never a config file. Connections carry an environment tag - Local, Staging, Production - so the production connection is visually distinct in the list before you click it. Nothing about pointing a diagram tool at a real database has to be an act of faith.
And because the connection persists, the diagram is not a one-time snapshot. Re-opening it pulls the current schema again: existing entities keep the positions you gave them, dropped tables disappear, new ones arrive ready to place. Keeping the ERD current stops being a separate job you keep postponing.
Why Relationships Disappear When You Import an ERD Into Lucidchart
The second symptom follows from the first. When schema arrives as a spreadsheet, the relationships arrive as columns in that spreadsheet, and whether they become lines on the canvas depends on the importer agreeing with your file. A Lucid community thread captures the experience exactly: I got my .csv file to import into LucidChart. I can see all of the tables. I clicked on the tables one at a time and no relationships were drawn. The documented behavior is that dragging related tables onto the canvas draws the relationship lines automatically when primary and foreign keys are set up correctly - which leaves the user debugging their CSV against an importer’s expectations rather than looking at their schema.
In a tool built around a database connection, this class of problem does not exist, because relationships are never re-derived from an intermediate file. Schemity reads the foreign key constraints themselves, and it reads their properties: cardinality comes from whether the foreign key is unique, so a 1:1 stays a 1:1 instead of being flattened into a 1:N on the way in. ON DELETE and ON UPDATE behavior is configurable per relationship. Draw a new N:N by dragging between two entities and the junction table is created for you, with both foreign keys and a composite primary key already in place.
The reverse direction is closed too. Change the model on the canvas and Schemity generates the SQL migration diff for you to read - it runs against the database only when you decide to apply it. If you would rather not connect at all, importing a SQL dump or a set of CREATE TABLE statements produces the same entities and relationships, and DBML import brings over schemas from dbdiagram.io and the wider DBML toolchain.
Side-by-Side
| Lucidchart | Schemity | |
|---|---|---|
| What it is | Visual collaboration suite; ERD is one shape library | Focused offline ERD tool for relational schemas |
| Platform | Browser, cloud account required | Native desktop app (macOS, Windows, Linux) |
| Getting schema in | Run a custom query, export TSV/CSV, upload the file | Direct connection or SSH tunnel; test before saving |
| Databases | Importer supports a fixed list; others via custom query | PostgreSQL, Supabase, MySQL, MariaDB, SQL Server, SQLite |
| Relationships | Derived from the imported file; must match the expected format | Read from the actual foreign key constraints |
| Keeping it current | Re-export and re-import | Re-sync on open; layout preserved, drift applied |
| Applying changes | Export SQL and run it yourself | Reviewed migration SQL diff, applied only on your approval |
| Where diagrams live | Documents in Lucid’s cloud | Plain JSON files in a folder you choose |
| Collaboration | Real-time multiplayer editing, comments, presentations | Single-designer by design; review happens in Git |
| Pricing | Per seat, ongoing; free tier limited to 3 documents / 60 shapes | $129 one-time, unlimited diagrams |
Placing 199 Tables by Hand
A third complaint in the same forum is the one that scales worst. A user importing a real database asked whether there is an easy way to add all tables, because adding one at a time for 199 tables is tedious and liable to errors as scrolling is terrible. The suggested fix is to drag the whole imported database onto the canvas at once - which solves the dragging and immediately produces the other problem, a single canvas holding 199 tables that nobody can read.
This is where a general canvas and a database tool genuinely diverge, because the answer is not a better auto-layout. It is that one diagram of every table was never the deliverable. Schemity reverse engineers the whole schema into a main view, gives you two predefined layouts to get past the initial pile, and then provides the tools that make a large schema navigable:
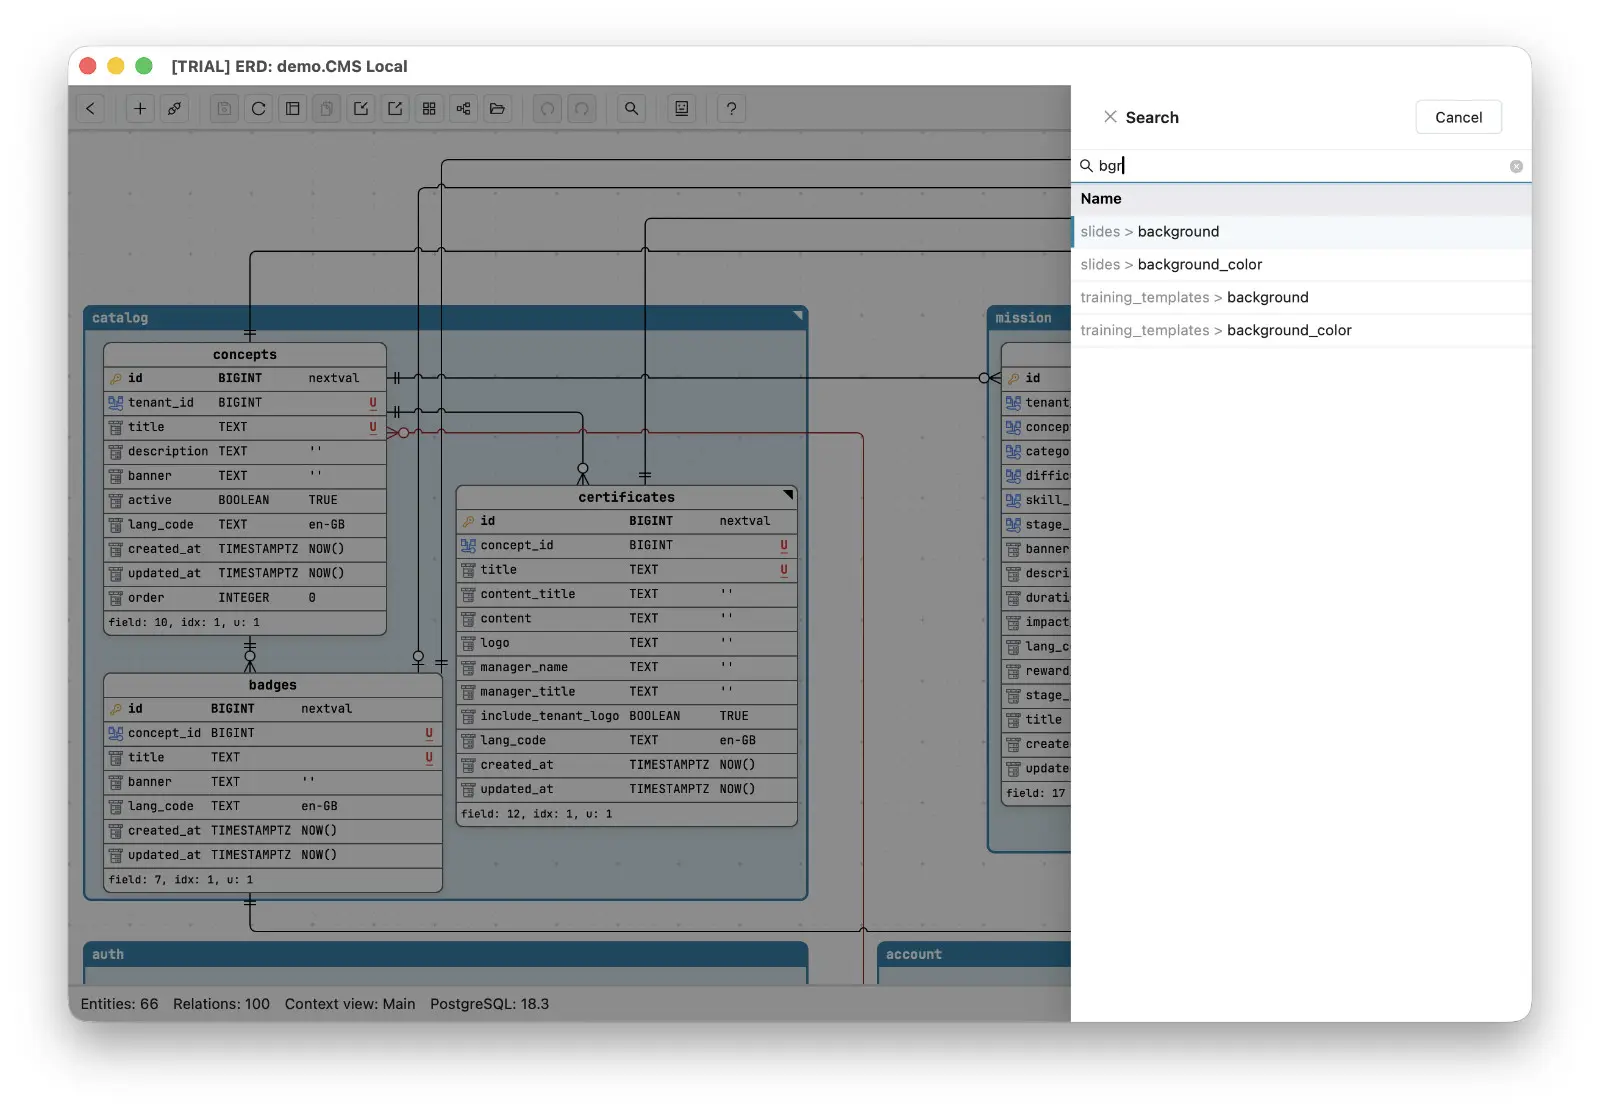
- Fuzzy search across entity and field names. Type any fragment you remember - not necessarily contiguous - and jump straight to the entity or field.
- Legends group related entities into named, colored regions on the canvas, so a 199-table diagram reads as a dozen domains.
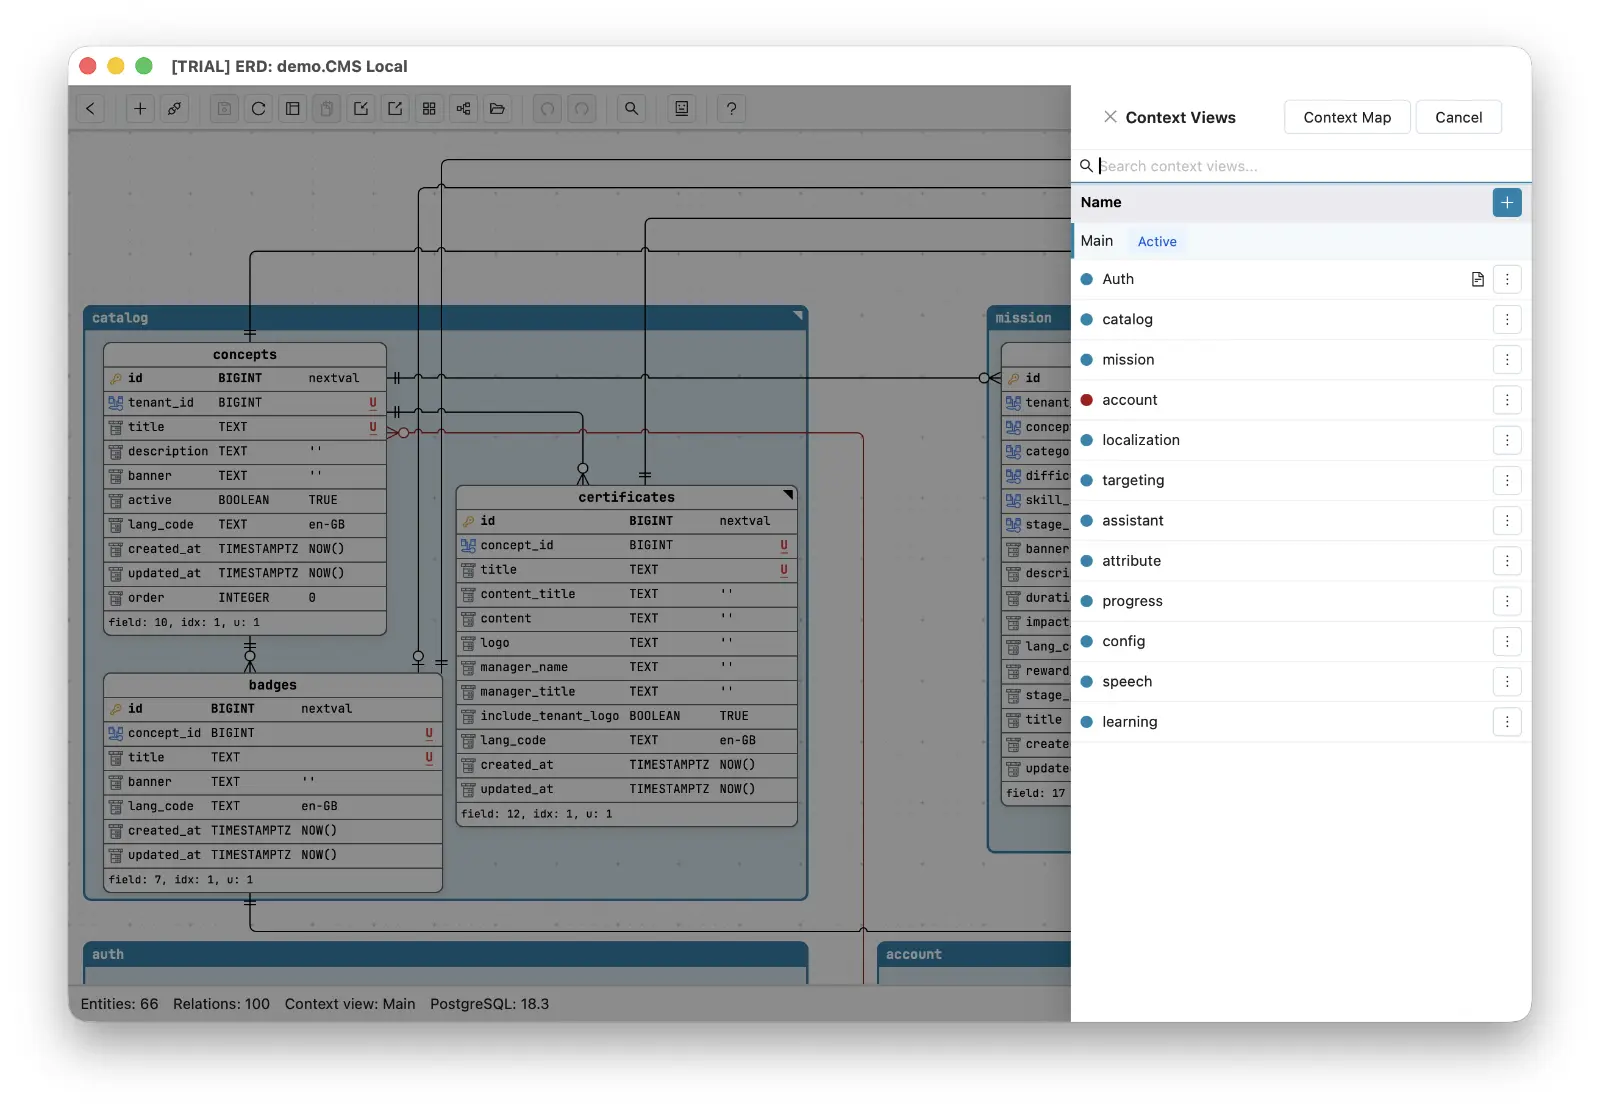
- Context views carve the schema into focused sub-diagrams. A context view is a focused subset of the main diagram that you arrange freely while the schema itself stays untouched, so the main view remains the single source of truth.
- The Context Map then renders each context as a single node with arrows for the foreign keys flowing between them - the architecture view your schema already contains.
Instead of one canvas nobody can read, the schema splits into a list of named context views - each a bounded subject area you can open on its own.
And the Context Map draws the dependencies between those contexts from the actual foreign keys, with a count on every arrow.
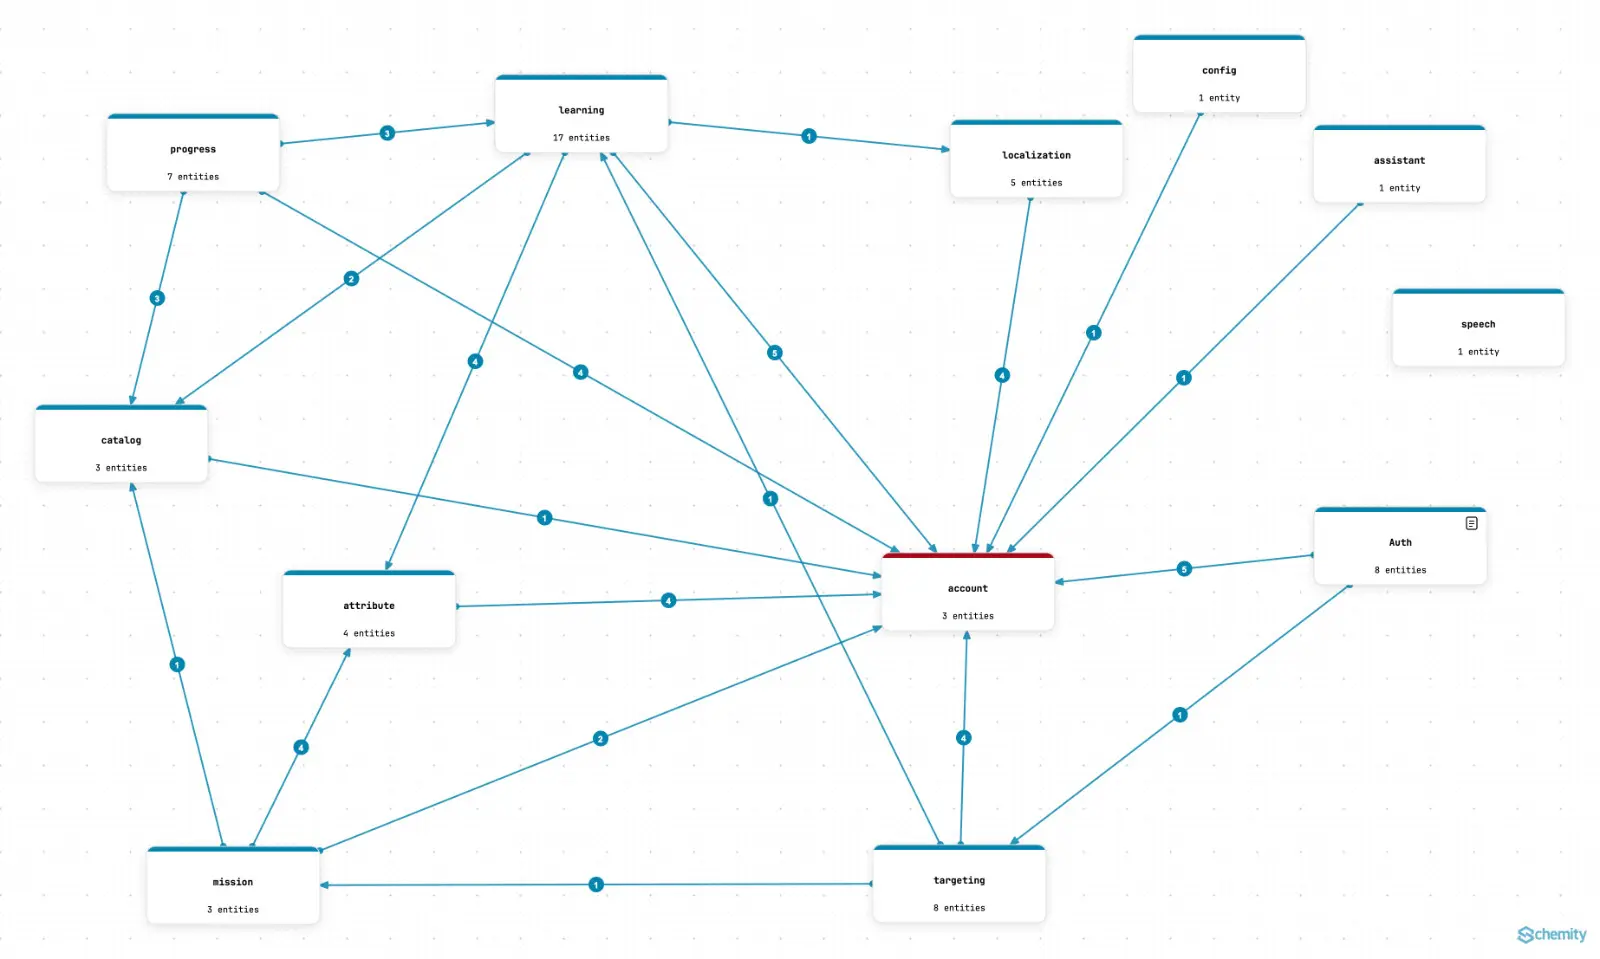
Nine readable diagrams beat one wall poster, and a tool that models perspectives natively gets you there without duplicating a single entity.
Where Lucidchart Wins
The concessions are real, and for some teams they decide it.
Real-time collaboration. Several people editing one diagram simultaneously, with cursors, comments, and @-mentions. Schemity does not do this and does not intend to - it takes a deliberate single-designer position where one person holds the pen and feedback arrives through review. If your process depends on a live shared canvas, Lucidchart is built for it and Schemity is not.
Everything else on the canvas. Your ERD sits next to the sequence diagram, the org chart, the flowchart, and the whiteboard workshop from last sprint - in one document, in one product, with one integration story into Confluence and Jira. Schemity draws database diagrams and nothing else.
Zero installation and universal access. A browser tab and a link. Non-technical stakeholders can open and comment without installing anything. Schemity’s read-only diagram mode lets someone explore a diagram without database access, but it is still an application they have to install.
A free entry point. Three documents and sixty shapes is not much, but it is enough to try the tool without a card. Schemity’s answer is a two-week full trial, after which designing keeps working.
What Is a Good Lucidchart Alternative for Entity Relationship Diagrams?
It depends on which half of Lucidchart you were actually using. If the value was the shared canvas and the whiteboard culture around it, no database-specific tool will replace that, and you should keep Lucidchart for the diagrams that are genuinely about communication.
If the value was the ERD - if you are diagramming a database that exists, or designing one that will - then the useful alternative is a tool whose primitives are tables, foreign keys, and migrations rather than shapes and connectors. Schemity is that tool in its offline desktop form: connect, reverse engineer, model with the keyboard, review the migration diff, and keep every diagram as a JSON file that lives in the repo next to the code it describes. That last part changes the review workflow more than anything else on this page - a schema change shows up as a readable diff in a pull request, not as a screenshot pasted into a ticket.
There is also the arithmetic. A per-seat subscription is a permanent line item; the diagram stays accessible exactly as long as you keep paying, and what you can model gets metered along the way. A $129 one-time purchase ERD tool with unlimited local workspaces has neither property.
Who Should Use Lucidchart
- Your diagrams are a team conversation and real-time co-editing is the point
- The ERD is one artifact among many kinds of diagram in the same workspace
- Stakeholders who will never install a desktop app need to open and comment
- Confluence, Jira, and the rest of the Atlassian surface are where your documentation lives
Who Should Use Schemity
- You are diagramming a database that exists, and want the tool to read it directly
- Your engines are PostgreSQL, Supabase, MySQL, MariaDB, SQL Server, or SQLite
- The ERD should live in Git, be reviewed in pull requests, and survive any vendor
- Schema changes should produce a migration diff you approve, not SQL you hand-write
- One purchase, no seats, no meter on how many tables you are allowed to model
The Bottom Line
Lucidchart is a strong diagramming product that happens to include ERD shapes. That framing explains every friction in this post: no live connection, relationships that depend on the file you fed it, and 199 tables to place by hand. If your diagram is a picture of a discussion, none of that matters.
If your diagram is a picture of a database, it matters constantly - and the fix is a desktop ERD tool that opens a connection, reads the constraints, keeps the layout, and writes the file to disk where Git can see it.
Comparing the database-native tools instead?
- The cloud-generation schema visualizer: see ChartDB alternative.
- The DSL-based sketch pad: see dbdiagram.io alternative.
- The full desktop database IDE: see DbSchema alternative.