
A data dictionary is a document, not a diagram, and it should be generated from the model you already keep rather than retyped into a spreadsheet. Schemity exports the current diagram as a data dictionary in three formats, covering every entity and column with its type, key role, nullability, default and description, the unique, check and index constraints on each table, and the relationships with their cardinality and delete rules.
The reason that matters has nothing to do with file formats. It is about who is asking.
How do I generate a data dictionary from my database?
From the diagram, if the diagram is already an accurate model of the database. That is the whole trick, and it is why the answer is usually so unsatisfying: most teams do not have a diagram that is current, so they fall back to querying the catalog by hand and pasting the results into a spreadsheet.
The people who need the document are rarely the people who own the tooling. An auditor wants to know what personal data the schema holds and where. A business analyst wants to filter a column list and sort it. A client at the end of an engagement wants something they can keep. A new engineer on day one wants to read the schema before touching it. Not one of them is going to install a desktop ERD tool, connect to a database and learn a canvas to get an answer, and none of their questions are answered by a picture of boxes and lines.
Why a diagram is not a data dictionary
A diagram shows shape. It shows that invoices points at customers and that line_items hangs off invoices. It does not tell you that invoices.voided_at is a nullable timestamp with no default, that status is constrained to four values, or that the delete rule on that relationship is RESTRICT rather than CASCADE. Those facts are the document’s entire job, and exporting the canvas as an image gives you none of them - which is a different failure from the image going blurry when someone zooms in, and a worse one.
So the document gets built by hand, and the size of the job is what kills it. A practitioner writing about re-oiling the gears for the data dictionary describes a warehouse holding “tens of thousands of columns across the various tables and views” and puts the failure plainly: “the size of the effort is always a barrier to doing it.” He also notes that “opposition to providing documentation is always quite vocal”, which is what happens when the ask is a manual one.
The free generators are the obvious escape, and they are genuinely useful when they work. They are also a project of their own: a Java runtime, the right JDBC driver, historically a Graphviz install, and a command line to get right before you see a single page. When it goes wrong it goes wrong quietly - one user pointed the standard generator at AdventureWorks2016 and got three tables back, reporting in January 2019 that the output was “Just some tables and columns. MIssing tables, relationships, constraints everting :(”. A documentation pipeline that can silently emit a partial document is worse than no pipeline, because the partial document looks finished.
Three formats, three readers
The dictionary exports as HTML, Markdown or an Excel workbook, and the reason there are three is that the three readers want genuinely different things.
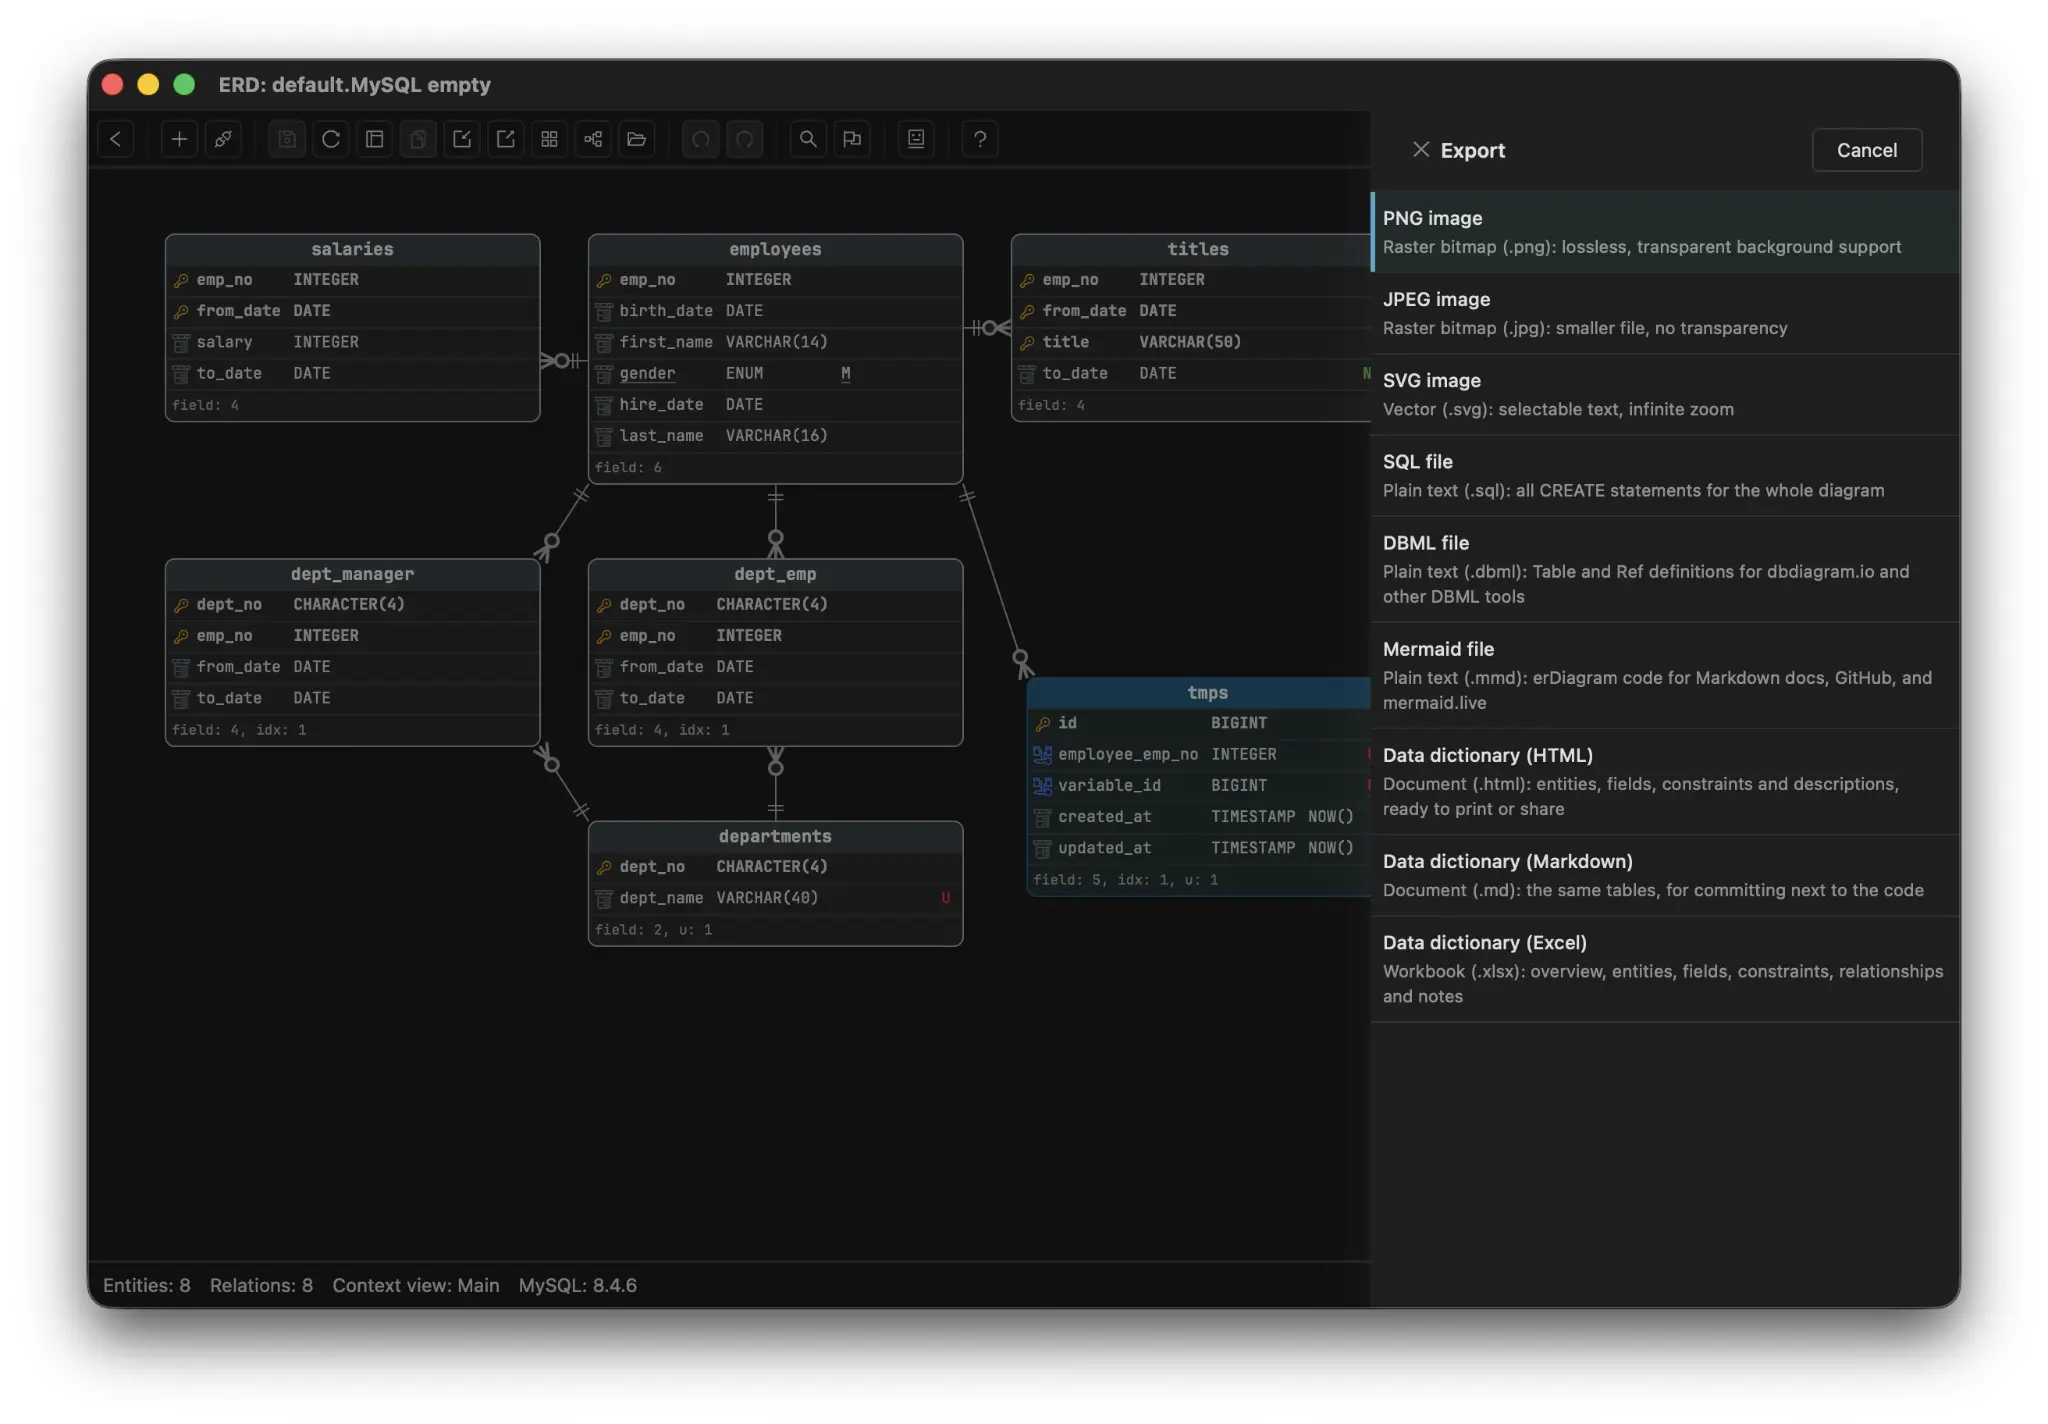
The export panel says the distinction out loud. The first three entries are images, the next three are code - .sql CREATE statements, .dbml table and ref definitions, .mmd erDiagram source - and the last three are documents: .html described as entities, fields, constraints and descriptions ready to print or share, .md as the same tables for committing next to the code, and .xlsx as a workbook of overview, entities, fields, constraints, relationships and notes. A picture, a definition of the schema, and a description of it are three different artifacts, and only the third one answers a question about a column.
| Format | Reader | What it is for |
|---|---|---|
| HTML | Someone who will never open Schemity | Print it, attach it, hand it over at the end of an engagement |
| Markdown | The engineers | Commit it beside the code so the document is reviewed in the same pull request as the migration |
| Excel | Analysts and auditors | Filter, sort and pivot a column list; six sheets covering overview, entities, fields, constraints, relationships and notes |
The Excel workbook always carries all six sheets, even when a sheet has no rows, so the shape of the file does not change with the diagram and a spreadsheet someone built on top of last quarter’s export still works on this quarter’s. Column counts are written as numbers rather than text, so they total - a small thing that decides whether the workbook is usable or merely present.
The export follows the active view. Exporting from a context view documents that context alone rather than the whole database. A context view is a saved, focused view of your schema that shows only a subset of entities and the relationships between them, so the billing context can be documented and handed to the payments team without shipping them seventy unrelated tables. The descriptions written on entities and legends travel into the document too, which is what turns a column list into something worth reading.
Why database views belong in the data dictionary
Schemity’s SQL, DBML and Mermaid exports leave database views out, and that is correct: those formats describe tables you can create, and a view is not one of them. A document is a different job. Someone checking what exists in the database needs to see the reporting layer and the security boundary, and an export that silently omits half the schema answers nothing.
So views appear in the dictionary, labelled as views rather than dropped. If your reporting layer or your PostgREST API surface is built on views, they are frequently the objects an analyst cares about most, and leaving views out of the model entirely is how they end up as undocumented infrastructure that nobody dares change.
The dictionary tells you what is not documented yet
Every engine will hold a description for every object. PostgreSQL stores them in pg_description and hands them back through col_description; the feature has been there for decades. What no engine offers is the second question: how many objects actually have one.
That gap is why documentation drives get abandoned. The same practitioner above wrote test procedures to “highlight any tables or columns with blank descriptions” and found they produced “too many failed tests when plugged into a legacy system” to be usable. The mechanism was right and the framing was wrong - graded as failures, an inherited schema is nothing but failures, and the report gets muted on the first run.
Schemity’s data dictionary closes with the same information stated as facts rather than verdicts: how many entities and fields carry a description, and the names of those that do not. It counts only what can actually be changed, so the columns of a database view, which are read-only, are never listed as missing anything. It states the numbers and stops there. On a legacy database the first export will say something bleak, and that is the point - the number is a work list, and it is the only measurement of documentation coverage most teams have ever had.
This is the same principle that makes schema lint report facts rather than grades: a deliberate choice reported as a mistake teaches people to ignore the report.
Generate it, do not maintain it
The reason a spreadsheet dictionary dies is that it is a second artifact requiring manual synchronization, and that arrangement fails eventually every time. The fix is not a better spreadsheet. It is to make the document a build output of a model that is already kept honest - one set of entities that the live database can be re-read into when it moves, with the document regenerated from it in one action.
That is the practical difference between documentation you write and documentation you produce. It is also why the meaning of the schema has to live in the diagram in the first place rather than in a wiki: descriptions attached to the model get carried into every export, and descriptions attached to a document get carried nowhere. For an inherited database, documenting it without diagramming all 800 tables and exporting one context at a time is the version of this that finishes.
Frequently asked questions
What is the difference between a data dictionary and an ERD?
An ERD is a picture that shows which tables exist and how they relate. A data dictionary is a document that lists every column with its type, nullability, default, constraints and a description of what it means. The diagram answers where something sits in the schema; the dictionary answers what a specific column is and what may be stored in it.
What should a database data dictionary contain?
Every entity and every column with its data type, key role, nullability, default and description, plus the unique, check and index constraints on each table and the relationships with their cardinality and delete rules. Database views belong in it too, labelled as views, because a reader checking what exists needs to see them.
How do you keep a data dictionary from going out of date?
Generate it from the model instead of maintaining it as a separate document. If the dictionary is exported from the same diagram the team already keeps in sync with the database, regenerating it is one action rather than a second round of edits nobody remembers to make.